Support Article
How BAT Levels Change Over Time
BAT Levels reflect the balance between two key brain proteins, Beta-Amyloid (Aβ) and Tau (T). When the brain’s cleanup and repair systems are efficient, these proteins are continuously cleared, keeping levels stable.
Over time, however, subtle changes in metabolism, inflammation, or cellular repair can cause BAT Levels to slowly rise, a process known as biological drift.
What Is Biological Drift?
Biological drift describes the gradual shift in biological markers over time. In the context of brain health, it can reflect a pattern where the body's ability to clear Beta-Amyloid and Tau may no longer be keeping pace as smoothly as before.
Unlike disease, drift is not damage. It can be an early measurable signal. When observed early through BAT Testing, it creates an opportunity for managing biological drift through a short reset cycle before more lasting changes take hold.
The Drift Curve
Research shows that BAT Levels typically rise slowly across decades, with key acceleration points around metabolic stress, hormonal change, or chronic inflammation.
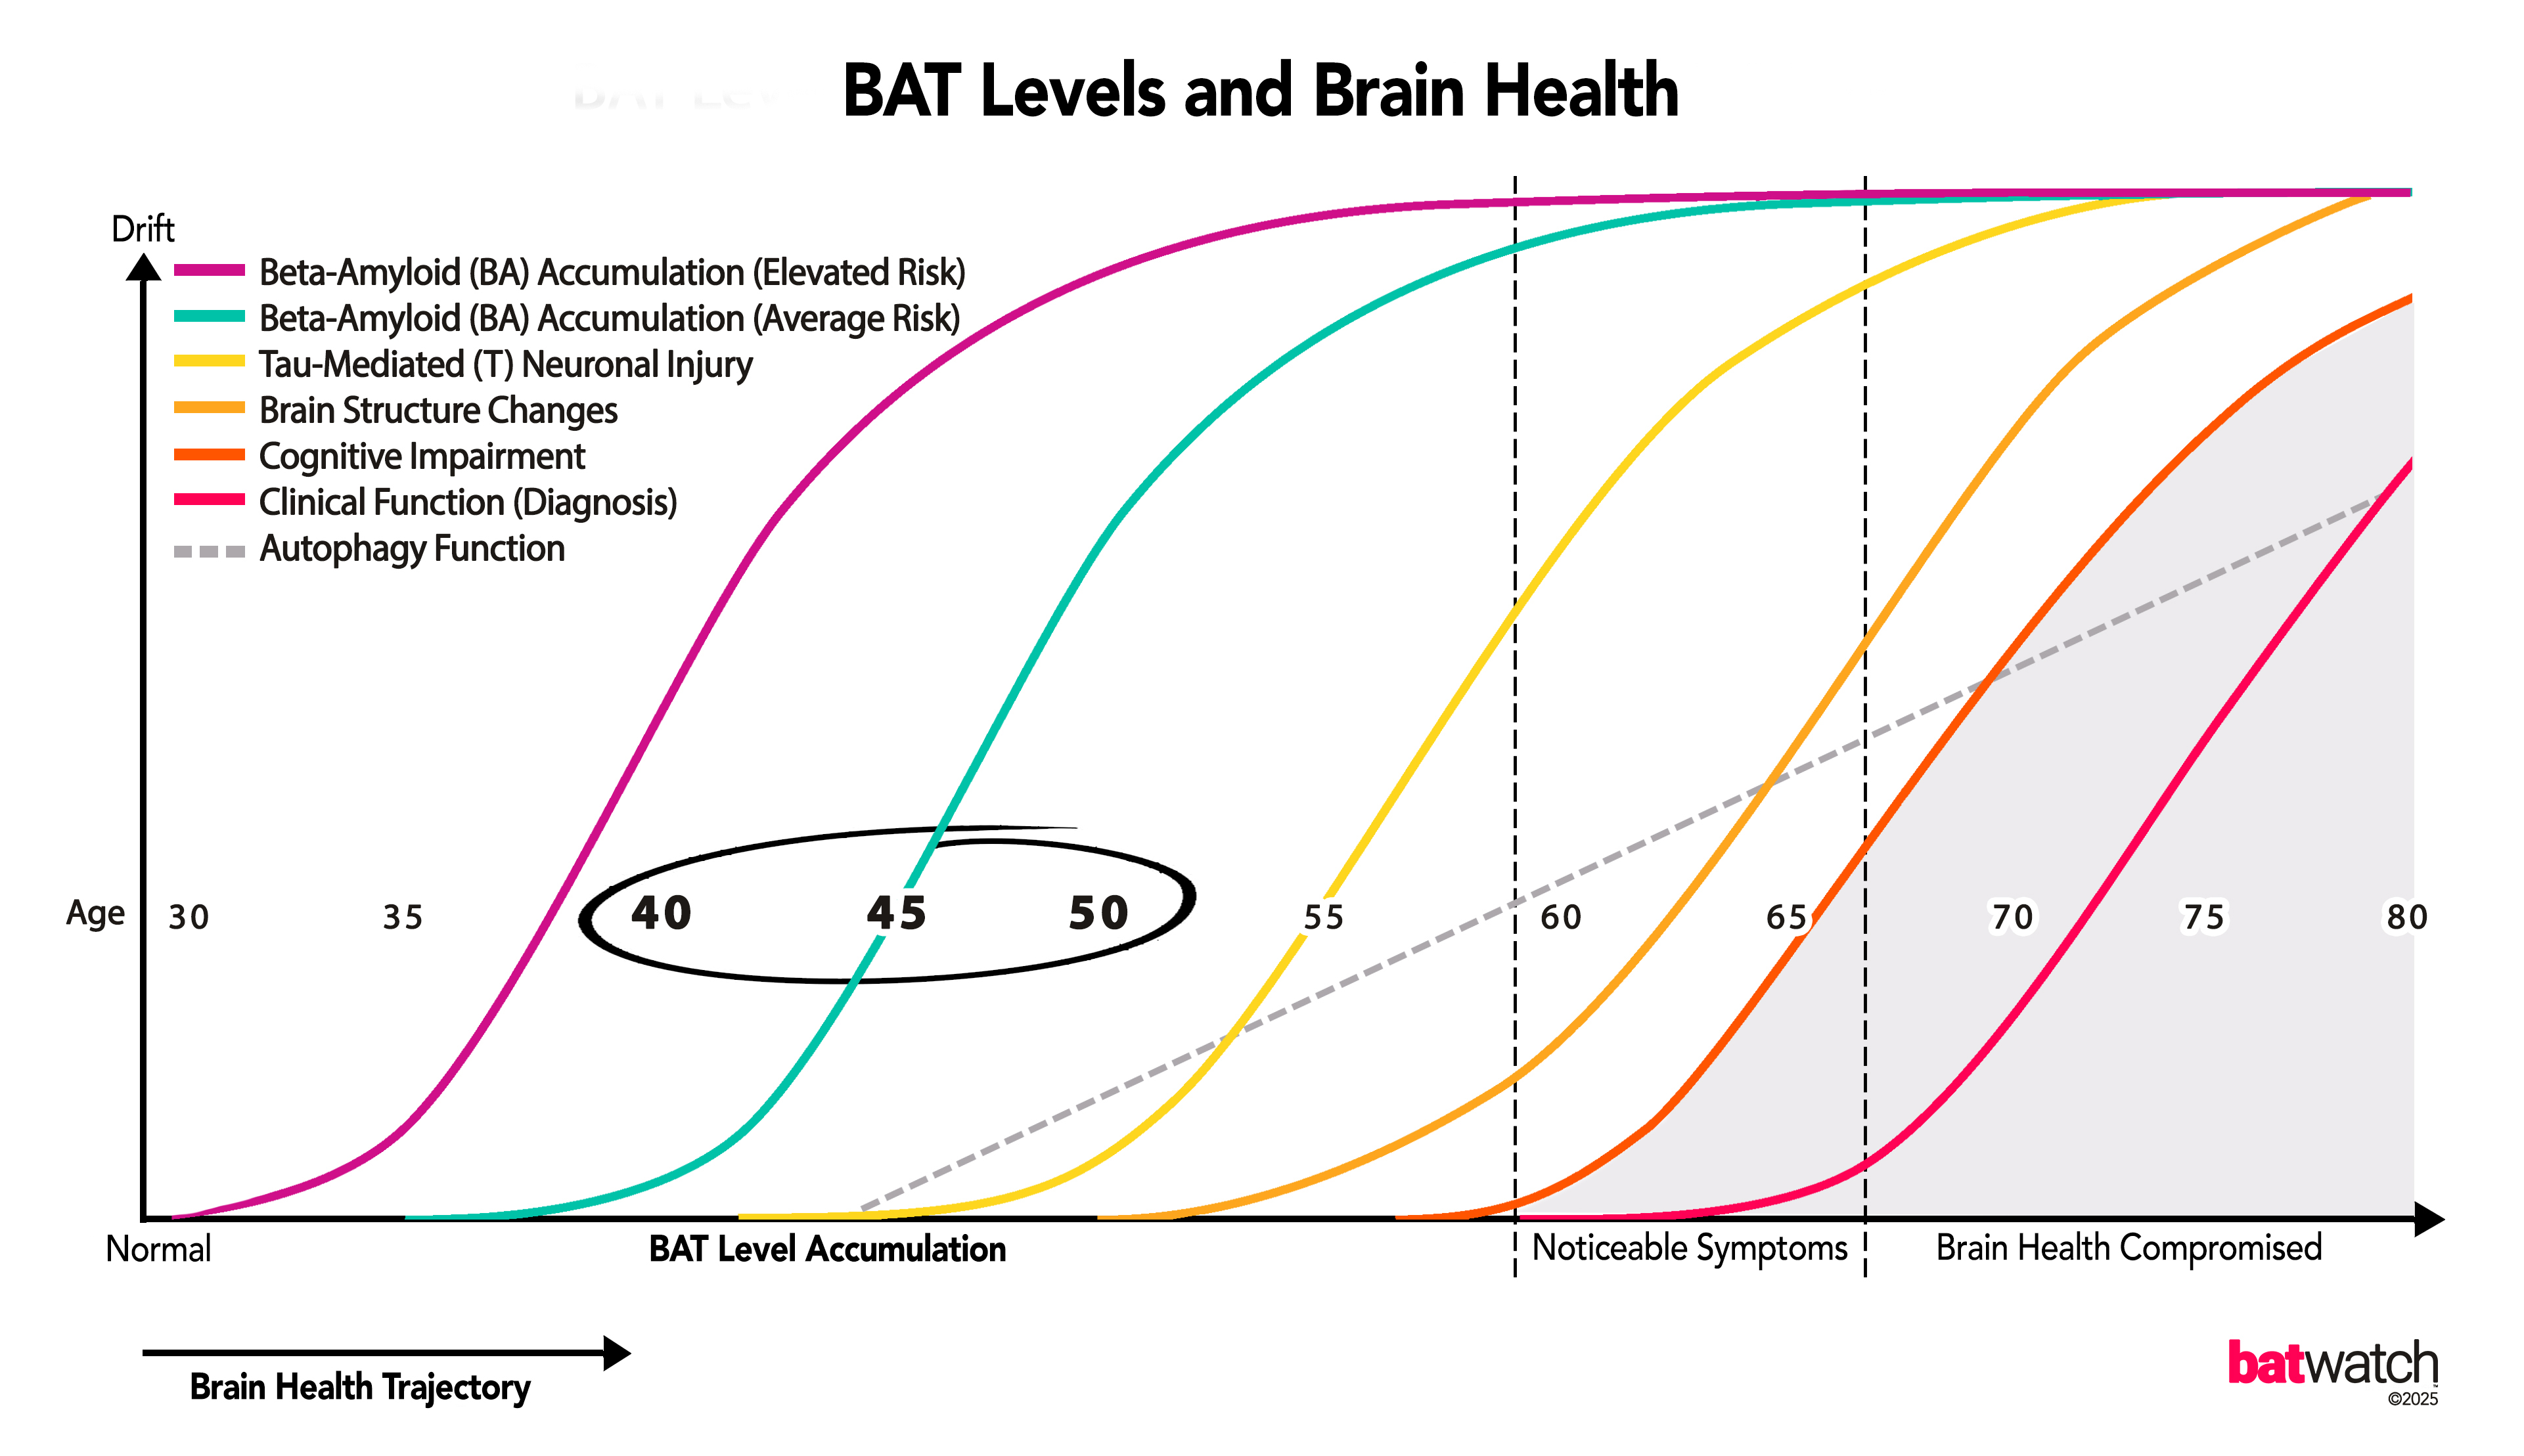
- Stable phase: levels remain within optimal range during early adulthood.
- Subtle drift: minor inefficiencies in cleanup begin to accumulate over time.
- Elevated phase: without a short reset cycle or ongoing monitoring, drift can continue to build before more noticeable brain health changes appear.
This curve helps explain why BAT Levels are tracked early and followed over time as part of long-term brain health management.
What Drives BAT Drift
Several biological factors have been linked to drift speed and direction:
- age-related slowdown in protein clearance pathways
- oxidative stress and inflammation, which interfere with autophagy and cellular repair
- metabolic dysfunction such as insulin resistance or high triglycerides
- genetic risk variants like APOE4, which alter how Beta-Amyloid is metabolized
- sleep, nutrition, and toxin exposure, all of which impact protein recycling efficiency
Each of these factors can gradually tilt the brain’s cleanup system off balance, a change BAT Testing can quantify before noticeable changes to brain health.
Monitoring and Managing Drift
Routine BAT Testing and BAT Checks establish a personal baseline and identify any upward drift over time.
When drift is confirmed, a short reset cycle may be discussed to support biological balance and ongoing trend monitoring over time.
After the reset, levels are re-tested to assess whether patterns appear steadier over time, and routine monitoring continues annually or biannually depending on risk profile. This ongoing cycle supports earlier visibility into biological change and helps guide long-term brain health management over time.
Why Biological Drift Is Manageable
Because BAT Levels reflect protein clearance performance, they can be supported through short reset cycles, lifestyle optimization, and ongoing monitoring.
By supporting patterns associated with the brain’s cleanup systems through short reset cycles, lifestyle optimization, and early monitoring, drift patterns may become steadier over time.
In this way, biological drift can remain a measurable indicator that helps guide long-term brain health management.
Key Takeaway
BAT Levels do not rise overnight. They drift slowly and measurably over time.
By tracking this drift early, people can use short reset cycles and steady monitoring to support long-term brain health tracking.
BAT Levels can provide an early measurable signal to monitor over time. Think of them like your brain's check-engine light. The goal is to pay attention before noticeable changes to brain health.
Recommended Direction
Related Articles
Managing BAT Levels
Learn how follow-up and support fit into the BAT model.
Managing Elevated BAT Levels
See what an elevated pattern may mean and what usually happens next.
Why BAT Levels Matter for Brain Health
See why BAT Levels matter in a prevention-first model.
BAT Levels vs. Cognitive Decline
Understand the difference between biomarkers and symptoms.
Parent Article
Related Terms
- BATCheck provides the check-in structure used to follow patterns over time.
- BATScore summarizes interpreted change.
- Clearance Rhythm provides the wider maintenance context.